Calculate resistance of isolates
portion.RdThese functions can be used to calculate the (co-)resistance of microbial isolates (i.e. percentage S, SI, I, IR or R). All functions support quasiquotation with pipes, can be used in dplyrs summarise and support grouped variables, see Examples.
portion_R and portion_IR can be used to calculate resistance, portion_S and portion_SI can be used to calculate susceptibility.
portion_R(..., minimum = 30, as_percent = FALSE,
  also_single_tested = FALSE)

portion_IR(..., minimum = 30, as_percent = FALSE,
  also_single_tested = FALSE)

portion_I(..., minimum = 30, as_percent = FALSE,
  also_single_tested = FALSE)

portion_SI(..., minimum = 30, as_percent = FALSE,
  also_single_tested = FALSE)

portion_S(..., minimum = 30, as_percent = FALSE,
  also_single_tested = FALSE)

portion_df(data, translate_ab = getOption("get_antibiotic_names",
  "official"), minimum = 30, as_percent = FALSE, combine_IR = FALSE)
Arguments
| ... | one or more vectors (or columns) with antibiotic interpretations. They will be transformed internally with |
|---|---|
| minimum | the minimal amount of available isolates. Any number lower than |
| as_percent | a logical to indicate whether the output must be returned as a hundred fold with % sign (a character). A value of |
| also_single_tested | a logical to indicate whether (in combination therapies) also observations should be included where not all antibiotics were tested, but at least one of the tested antibiotics contains a target interpretation (e.g. S in case of |
| data | a |
| translate_ab | a column name of the |
| combine_IR | a logical to indicate whether all values of I and R must be merged into one, so the output only consists of S vs. IR (susceptible vs. non-susceptible) |
Source
M39 Analysis and Presentation of Cumulative Antimicrobial Susceptibility Test Data, 4th Edition, 2014, Clinical and Laboratory Standards Institute (CLSI). https://clsi.org/standards/products/microbiology/documents/m39/.
Wickham H. Tidy Data. The Journal of Statistical Software, vol. 59, 2014. http://vita.had.co.nz/papers/tidy-data.html
Value
Double or, when as_percent = TRUE, a character.
Details
Remember that you should filter your table to let it contain only first isolates! Use first_isolate to determine them in your data set.
These functions are not meant to count isolates, but to calculate the portion of resistance/susceptibility. Use the count functions to count isolates. Low counts can infuence the outcome - these portion functions may camouflage this, since they only return the portion albeit being dependent on the minimum parameter.
portion_df takes any variable from data that has an "rsi" class (created with as.rsi) and calculates the portions R, I and S. The resulting tidy data (see Source) data.frame will have three rows (S/I/R) and a column for each variable with class "rsi".
The old rsi function is still available for backwards compatibility but is deprecated.
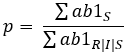
To calculate the probability (p) of susceptibility of one antibiotic, we use this formula:
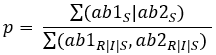
For two antibiotics:
For three antibiotics:

And so on.
See also
count_* to count resistant and susceptible isolates.
Examples
# septic_patients is a data set available in the AMR package. It is true, genuine data. ?septic_patients#># Calculate resistance portion_R(septic_patients$amox)#> [1] 0.5827645portion_IR(septic_patients$amox)#> [1] 0.5853242# Or susceptibility portion_S(septic_patients$amox)#> [1] 0.4146758portion_SI(septic_patients$amox)#> [1] 0.4172355#> [1] 0.5827645septic_patients %>% portion_IR(amox)#> [1] 0.5853242septic_patients %>% portion_S(amox)#> [1] 0.4146758septic_patients %>% portion_SI(amox)#> [1] 0.4172355septic_patients %>% group_by(hospital_id) %>% summarise(p = portion_S(cipr), n = n_rsi(cipr)) # n_rsi works like n_distinct in dplyr#> # A tibble: 4 x 3 #> hospital_id p n #> <fct> <dbl> <int> #> 1 A 0.860 207 #> 2 B 0.760 499 #> 3 C 0.688 202 #> 4 D 0.830 501septic_patients %>% group_by(hospital_id) %>% summarise(R = portion_R(cipr, as_percent = TRUE), I = portion_I(cipr, as_percent = TRUE), S = portion_S(cipr, as_percent = TRUE), n = n_rsi(cipr), # works like n_distinct in dplyr total = n()) # NOT the amount of tested isolates!#> # A tibble: 4 x 6 #> hospital_id R I S n total #> <fct> <chr> <chr> <chr> <int> <int> #> 1 A 12.6% 1.4% 86.0% 207 321 #> 2 B 17.0% 7.0% 76.0% 499 663 #> 3 C 20.3% 10.9% 68.8% 202 254 #> 4 D 15.2% 1.8% 83.0% 501 762# Calculate co-resistance between amoxicillin/clav acid and gentamicin, # so we can see that combination therapy does a lot more than mono therapy: septic_patients %>% portion_S(amcl) # S = 67.1%#> [1] 0.7062363#> [1] 1828septic_patients %>% portion_S(gent) # S = 74.0%#> [1] 0.7396226#> [1] 1855septic_patients %>% portion_S(amcl, gent) # S = 92.0%#> [1] 0.9210074#> [1] 1747septic_patients %>% group_by(hospital_id) %>% summarise(cipro_p = portion_S(cipr, as_percent = TRUE), cipro_n = count_all(cipr), genta_p = portion_S(gent, as_percent = TRUE), genta_n = count_all(gent), combination_p = portion_S(cipr, gent, as_percent = TRUE), combination_n = count_all(cipr, gent))#> # A tibble: 4 x 7 #> hospital_id cipro_p cipro_n genta_p genta_n combination_p combination_n #> <fct> <chr> <int> <chr> <int> <chr> <int> #> 1 A 86.0% 207 76.0% 300 95.0% 202 #> 2 B 76.0% 499 71.5% 606 91.4% 488 #> 3 C 68.8% 202 75.8% 240 91.5% 201 #> 4 D 83.0% 501 74.6% 709 95.0% 499# Get portions S/I/R immediately of all rsi columns septic_patients %>% select(amox, cipr) %>% portion_df(translate = FALSE)#> Interpretation Antibiotic Value #> 1 S amox 0.414675768 #> 2 I amox 0.002559727 #> 3 R amox 0.582764505 #> 4 S cipr 0.789212207 #> 5 I cipr 0.048970901 #> 6 R cipr 0.161816891# It also supports grouping variables septic_patients %>% select(hospital_id, amox, cipr) %>% group_by(hospital_id) %>% portion_df(translate = FALSE)#> # A tibble: 24 x 4 #> Interpretation hospital_id Antibiotic Value #> <ord> <fct> <chr> <dbl> #> 1 S A amox 0.42 #> 2 S B amox 0.378 #> 3 S C amox 0.373 #> 4 S D amox 0.454 #> 5 I A amox 0 #> 6 I B amox 0.00268 #> 7 I C amox 0 #> 8 I D amox 0.00407 #> 9 R A amox 0.580 #> 10 R B amox 0.619 #> # ... with 14 more rows# NOT RUN { # calculate current empiric combination therapy of Helicobacter gastritis: my_table %>% filter(first_isolate == TRUE, genus == "Helicobacter") %>% summarise(p = portion_S(amox, metr), # amoxicillin with metronidazole n = count_all(amox, metr)) # }