# `AMR`
### An [R package](https://www.r-project.org) to simplify the analysis and prediction of Antimicrobial Resistance (AMR).
[](https://www.rug.nl)[](https://www.umcg.nl)
This R package was created for academic research by PhD students of the Faculty of Medical Sciences of the [University of Groningen](https://www.rug.nl) and the Medical Microbiology & Infection Prevention (MMBI) department of the [University Medical Center Groningen (UMCG)](https://www.umcg.nl). See [Authors](#authors).
## Why this package?
This R package contains functions to make **microbiological, epidemiological data analysis easier**. It allows the use of some new classes to work with MIC values and antimicrobial interpretations (i.e. values S, I and R).
With `AMR` you can also:
* Create frequency tables with the `freq` function
* Conduct AMR analysis with the `rsi` function, that can also be used with the `dplyr` package (e.g. in conjunction with `summarise`) to calculate the resistance percentages (and even co-resistance) of different antibiotic columns of a table
* Predict antimicrobial resistance for the nextcoming years with the `rsi_predict` function
* Apply [EUCAST rules to isolates](http://www.eucast.org/expert_rules_and_intrinsic_resistance/) with the `EUCAST_rules` function
* Identify first isolates of every patient [using guidelines from the CLSI](https://clsi.org/standards/products/microbiology/documents/m39/) (Clinical and Laboratory Standards Institute) with the `first_isolate` function
* Translate antibiotic codes from the lab (like `"AMOX"`) or the [WHO](https://www.whocc.no/atc_ddd_index/?code=J01CA04&showdescription=no) (like `"J01CA04"`) to trivial names (like `"amoxicillin"`) with the `abname` function
With the `MDRO` function (abbreviation of Multi Drug Resistant Organisms), you can check your isolates for exceptional resistance with country-specific guidelines or EUCAST rules. Currently guidelines for Germany and the Netherlands are supported. Please suggest addition of your own country here: [https://github.com/msberends/AMR/issues/new](https://github.com/msberends/AMR/issues/new?title=New%20guideline%20for%20MDRO&body=%3C--%20Please%20add%20your%20country%20code,%20guideline%20name,%20version%20and%20source%20below%20and%20remove%20this%20line--%3E).
This package contains an example data set `septic_patients`, consisting of 2000 isolates from anonymised septic patients between 2001 and 2017.
## How to get it?
This package is available on CRAN and also here on GitHub.
### From CRAN (recommended)
[](http://cran.r-project.org/package=AMR)
[](http://cran.r-project.org/package=AMR)
[](http://cran.r-project.org/package=AMR)
-  In [RStudio](http://www.rstudio.com) (recommended):
- Click on `Tools` and then `Install Packages...`
- Type in `AMR` and press Install
-
In [RStudio](http://www.rstudio.com) (recommended):
- Click on `Tools` and then `Install Packages...`
- Type in `AMR` and press Install
-  In R directly:
- `install.packages("AMR")`
-
In R directly:
- `install.packages("AMR")`
-  In [Exploratory.io](https://exploratory.io):
- (Exploratory.io costs $40/month but the somewhat limited Community Plan is free for students and teachers, [click here to enroll](https://exploratory.io/plan?plan=Community))
- Start the software and log in
- Click on your username at the right hand side top
- Click on `R Packages`
- Click on the `Install` tab
- Type in `AMR` and press Install
- Once it’s installed it will show up in the `User Packages` section under the `Packages` tab.
### From GitHub (latest development version)
[](https://travis-ci.org/msberends/AMR)
[](https://github.com/msberends/AMR/commits/master)
[](https://github.com/msberends/AMR/commits/master)
[](https://codecov.io/gh/msberends/AMR)
```r
install.packages("devtools")
devtools::install_github("msberends/AMR")
```
## How to use it?
```r
# Call it with:
library(AMR)
# For a list of functions:
help(package = "AMR")
```
### Overwrite/force resistance based on EUCAST rules
This is also called *interpretive reading*.
```r
before <- data.frame(bactid = c("STAAUR", # Staphylococcus aureus
"ENCFAE", # Enterococcus faecalis
"ESCCOL", # Escherichia coli
"KLEPNE", # Klebsiella pneumoniae
"PSEAER"), # Pseudomonas aeruginosa
vanc = "-", # Vancomycin
amox = "-", # Amoxicillin
coli = "-", # Colistin
cfta = "-", # Ceftazidime
cfur = "-", # Cefuroxime
stringsAsFactors = FALSE)
before
# bactid vanc amox coli cfta cfur
# 1 STAAUR - - - - -
# 2 ENCFAE - - - - -
# 3 ESCCOL - - - - -
# 4 KLEPNE - - - - -
# 5 PSEAER - - - - -
# Now apply those rules; just need a column with bacteria ID's and antibiotic results:
after <- EUCAST_rules(before)
after
# bactid vanc amox coli cfta cfur
# 1 STAAUR - - R R -
# 2 ENCFAE - - R R R
# 3 ESCCOL R - - - -
# 4 KLEPNE R R - - -
# 5 PSEAER R R - - R
```
### Frequency tables
Base R lacks a simple function to create frequency tables. We created such a function that works with almost all data types: `freq` (or `frequency_tbl`).
```r
## Factors sort on item by default:
freq(septic_patients$hospital_id)
# Class: factor
# Length: 2000 (of which NA: 0 = 0.0%)
# Unique: 5
#
# Item Count Percent Cum. Count Cum. Percent (Factor Level)
# ----- ------ -------- ----------- ------------- ---------------
# A 233 11.7% 233 11.7% 1
# B 583 29.1% 816 40.8% 2
# C 221 11.1% 1037 51.8% 3
# D 650 32.5% 1687 84.4% 4
# E 313 15.7% 2000 100.0% 5
## This can be changed with the `sort.count` parameter:
freq(septic_patients$hospital_id, sort.count = TRUE)
# Class: factor
# Length: 2000 (of which NA: 0 = 0.0%)
# Unique: 5
#
# Item Count Percent Cum. Count Cum. Percent (Factor Level)
# ----- ------ -------- ----------- ------------- ---------------
# D 650 32.5% 650 32.5% 4
# B 583 29.1% 1233 61.7% 2
# E 313 15.7% 1546 77.3% 5
# A 233 11.7% 1779 88.9% 1
# C 221 11.1% 2000 100.0% 3
## Other types, like numbers or dates, sort on count by default:
> freq(septic_patients$date)
# Class: Date
# Length: 2000 (of which NA: 0 = 0.0%)
# Unique: 1662
#
# Oldest: 2 January 2001
# Newest: 18 October 2017 (+6133)
#
# Item Count Percent Cum. Count Cum. Percent
# ----------- ------ -------- ----------- -------------
# 2008-12-24 5 0.2% 5 0.2%
# 2010-12-10 4 0.2% 9 0.4%
# 2011-03-03 4 0.2% 13 0.6%
# 2013-06-24 4 0.2% 17 0.8%
# 2017-09-01 4 0.2% 21 1.1%
# 2002-09-02 3 0.2% 24 1.2%
# 2003-10-14 3 0.2% 27 1.4%
# 2004-06-25 3 0.2% 30 1.5%
# 2004-06-27 3 0.2% 33 1.7%
# 2004-10-29 3 0.2% 36 1.8%
# 2005-09-27 3 0.2% 39 2.0%
# 2006-08-01 3 0.2% 42 2.1%
# 2006-10-10 3 0.2% 45 2.2%
# 2007-11-16 3 0.2% 48 2.4%
# 2008-03-09 3 0.2% 51 2.5%
# ... and 1647 more (n = 1949; 97.5%). Use `nmax` to show more rows.
## For numeric values, some extra descriptive statistics will be calculated:
> freq(runif(n = 10, min = 1, max = 5))
# Class: numeric
# Length: 10 (of which NA: 0 = 0.0%)
# Unique: 10
#
# Mean: 3
# Std. dev.: 0.93 (CV: 0.31)
# Five-Num: 1.1 | 2.3 | 3.1 | 3.8 | 4.0 (CQV: 0.25)
# Outliers: 0
#
# Item Count Percent Cum. Count Cum. Percent
# --------- ------ -------- ----------- -------------
# 1.132033 1 10.0% 1 10.0%
# 2.226903 1 10.0% 2 20.0%
# 2.280779 1 10.0% 3 30.0%
# 2.640898 1 10.0% 4 40.0%
# 2.913462 1 10.0% 5 50.0%
# 3.364201 1 10.0% 6 60.0%
# 3.771975 1 10.0% 7 70.0%
# 3.802861 1 10.0% 8 80.0%
# 3.803547 1 10.0% 9 90.0%
# 3.985691 1 10.0% 10 100.0%
#
# Warning message:
# All observations are unique.
```
Learn more about this function with:
```r
?freq
```
### New classes
This package contains two new S3 classes: `mic` for MIC values (e.g. from Vitek or Phoenix) and `rsi` for antimicrobial drug interpretations (i.e. S, I and R). Both are actually ordered factors under the hood (an MIC of `2` being higher than `<=1` but lower than `>=32`, and for class `rsi` factors are ordered as `S < I < R`).
Both classes have extensions for existing generic functions like `print`, `summary` and `plot`.
```r
# Transform values to new classes
mic_data <- as.mic(c(">=32", "1.0", "8", "<=0.128", "8", "16", "16"))
rsi_data <- as.rsi(c(rep("S", 474), rep("I", 36), rep("R", 370)))
```
These functions also try to coerce valid values.
Quick overviews when just printing objects:
```r
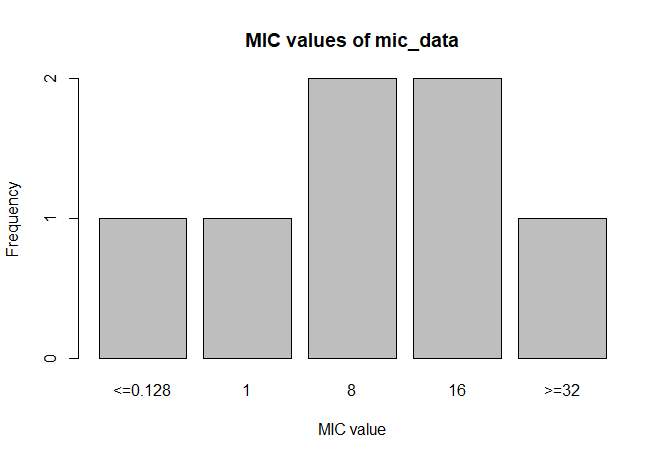
mic_data
# Class 'mic': 7 isolates
#
# 0
#
# <=0.128 1 8 16 >=32
# 1 1 2 2 1
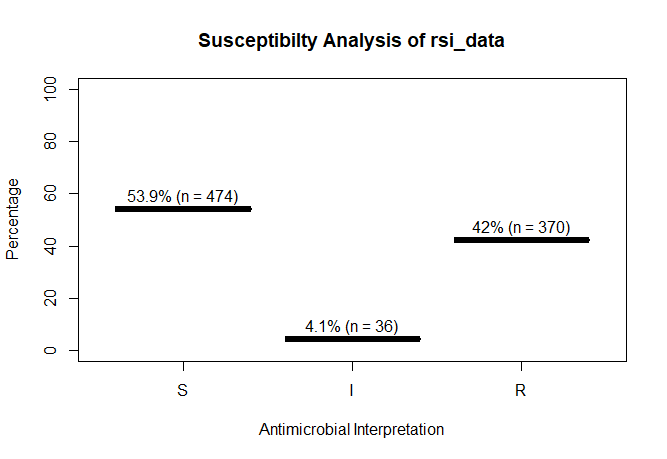
rsi_data
# Class 'rsi': 880 isolates
#
# : 0
# Sum of S: 474
# Sum of IR: 406
# - Sum of R: 370
# - Sum of I: 36
#
# %S %IR %I %R
# 53.9 46.1 4.1 42.0
```
A plot of `rsi_data`:
```r
plot(rsi_data)
```
A plot of `mic_data` (defaults to bar plot):
```r
plot(mic_data)
```
Other epidemiological functions:
```r
# Determine key antibiotic based on bacteria ID
key_antibiotics(...)
# Selection of first isolates of any patient
first_isolate(...)
# Calculate resistance levels of antibiotics, can be used with `summarise` (dplyr)
rsi(...)
# Predict resistance levels of antibiotics
rsi_predict(...)
# Get name of antibiotic by ATC code
abname(...)
abname("J01CR02", from = "atc", to = "umcg") # "AMCL"
```
### Databases included in package
Datasets to work with antibiotics and bacteria properties.
```r
# Dataset with 2000 random blood culture isolates from anonymised
# septic patients between 2001 and 2017 in 5 Dutch hospitals
septic_patients # A tibble: 4,000 x 47
# Dataset with ATC antibiotics codes, official names, trade names
# and DDD's (oral and parenteral)
antibiotics # A tibble: 420 x 18
# Dataset with bacteria codes and properties like gram stain and
# aerobic/anaerobic
microorganisms # A tibble: 2,453 x 12
```
## Authors
- [Berends MS](https://github.com/msberends)1,2, PhD Student
- [Luz CF](https://github.com/ceefluz)1, PhD Student
- [Hassing EEA](https://github.com/erwinhassing)2, Data Analyst (contributor)
1 Department of Medical Microbiology, University of Groningen, University Medical Center Groningen, Groningen, the Netherlands
2 Certe Medical Diagnostics & Advice, Groningen, the Netherlands
[](https://www.umcg.nl)[](https://www.certe.nl)[](http://www.eurhealth-1health.eu)[](http://www.eurhealth-1health.eu)
## Copyright
[](https://github.com/msberends/AMR/blob/master/LICENSE)
This R package is licensed under the [GNU General Public License (GPL) v2.0](https://github.com/msberends/AMR/blob/master/LICENSE). In a nutshell, this means that this package:
- May be used for commercial purposes
- May be used for private purposes
- May **not** be used for patent purposes
- May be modified, although:
- Modifications **must** be released under the same license when distributing the package
- Changes made to the code **must** be documented
- May be distributed, although:
- Source code **must** be made available when the package is distributed
- A copy of the license and copyright notice **must** be included with the package.
- Comes with a LIMITATION of liability
- Comes with NO warranty
In [Exploratory.io](https://exploratory.io):
- (Exploratory.io costs $40/month but the somewhat limited Community Plan is free for students and teachers, [click here to enroll](https://exploratory.io/plan?plan=Community))
- Start the software and log in
- Click on your username at the right hand side top
- Click on `R Packages`
- Click on the `Install` tab
- Type in `AMR` and press Install
- Once it’s installed it will show up in the `User Packages` section under the `Packages` tab.
### From GitHub (latest development version)
[](https://travis-ci.org/msberends/AMR)
[](https://github.com/msberends/AMR/commits/master)
[](https://github.com/msberends/AMR/commits/master)
[](https://codecov.io/gh/msberends/AMR)
```r
install.packages("devtools")
devtools::install_github("msberends/AMR")
```
## How to use it?
```r
# Call it with:
library(AMR)
# For a list of functions:
help(package = "AMR")
```
### Overwrite/force resistance based on EUCAST rules
This is also called *interpretive reading*.
```r
before <- data.frame(bactid = c("STAAUR", # Staphylococcus aureus
"ENCFAE", # Enterococcus faecalis
"ESCCOL", # Escherichia coli
"KLEPNE", # Klebsiella pneumoniae
"PSEAER"), # Pseudomonas aeruginosa
vanc = "-", # Vancomycin
amox = "-", # Amoxicillin
coli = "-", # Colistin
cfta = "-", # Ceftazidime
cfur = "-", # Cefuroxime
stringsAsFactors = FALSE)
before
# bactid vanc amox coli cfta cfur
# 1 STAAUR - - - - -
# 2 ENCFAE - - - - -
# 3 ESCCOL - - - - -
# 4 KLEPNE - - - - -
# 5 PSEAER - - - - -
# Now apply those rules; just need a column with bacteria ID's and antibiotic results:
after <- EUCAST_rules(before)
after
# bactid vanc amox coli cfta cfur
# 1 STAAUR - - R R -
# 2 ENCFAE - - R R R
# 3 ESCCOL R - - - -
# 4 KLEPNE R R - - -
# 5 PSEAER R R - - R
```
### Frequency tables
Base R lacks a simple function to create frequency tables. We created such a function that works with almost all data types: `freq` (or `frequency_tbl`).
```r
## Factors sort on item by default:
freq(septic_patients$hospital_id)
# Class: factor
# Length: 2000 (of which NA: 0 = 0.0%)
# Unique: 5
#
# Item Count Percent Cum. Count Cum. Percent (Factor Level)
# ----- ------ -------- ----------- ------------- ---------------
# A 233 11.7% 233 11.7% 1
# B 583 29.1% 816 40.8% 2
# C 221 11.1% 1037 51.8% 3
# D 650 32.5% 1687 84.4% 4
# E 313 15.7% 2000 100.0% 5
## This can be changed with the `sort.count` parameter:
freq(septic_patients$hospital_id, sort.count = TRUE)
# Class: factor
# Length: 2000 (of which NA: 0 = 0.0%)
# Unique: 5
#
# Item Count Percent Cum. Count Cum. Percent (Factor Level)
# ----- ------ -------- ----------- ------------- ---------------
# D 650 32.5% 650 32.5% 4
# B 583 29.1% 1233 61.7% 2
# E 313 15.7% 1546 77.3% 5
# A 233 11.7% 1779 88.9% 1
# C 221 11.1% 2000 100.0% 3
## Other types, like numbers or dates, sort on count by default:
> freq(septic_patients$date)
# Class: Date
# Length: 2000 (of which NA: 0 = 0.0%)
# Unique: 1662
#
# Oldest: 2 January 2001
# Newest: 18 October 2017 (+6133)
#
# Item Count Percent Cum. Count Cum. Percent
# ----------- ------ -------- ----------- -------------
# 2008-12-24 5 0.2% 5 0.2%
# 2010-12-10 4 0.2% 9 0.4%
# 2011-03-03 4 0.2% 13 0.6%
# 2013-06-24 4 0.2% 17 0.8%
# 2017-09-01 4 0.2% 21 1.1%
# 2002-09-02 3 0.2% 24 1.2%
# 2003-10-14 3 0.2% 27 1.4%
# 2004-06-25 3 0.2% 30 1.5%
# 2004-06-27 3 0.2% 33 1.7%
# 2004-10-29 3 0.2% 36 1.8%
# 2005-09-27 3 0.2% 39 2.0%
# 2006-08-01 3 0.2% 42 2.1%
# 2006-10-10 3 0.2% 45 2.2%
# 2007-11-16 3 0.2% 48 2.4%
# 2008-03-09 3 0.2% 51 2.5%
# ... and 1647 more (n = 1949; 97.5%). Use `nmax` to show more rows.
## For numeric values, some extra descriptive statistics will be calculated:
> freq(runif(n = 10, min = 1, max = 5))
# Class: numeric
# Length: 10 (of which NA: 0 = 0.0%)
# Unique: 10
#
# Mean: 3
# Std. dev.: 0.93 (CV: 0.31)
# Five-Num: 1.1 | 2.3 | 3.1 | 3.8 | 4.0 (CQV: 0.25)
# Outliers: 0
#
# Item Count Percent Cum. Count Cum. Percent
# --------- ------ -------- ----------- -------------
# 1.132033 1 10.0% 1 10.0%
# 2.226903 1 10.0% 2 20.0%
# 2.280779 1 10.0% 3 30.0%
# 2.640898 1 10.0% 4 40.0%
# 2.913462 1 10.0% 5 50.0%
# 3.364201 1 10.0% 6 60.0%
# 3.771975 1 10.0% 7 70.0%
# 3.802861 1 10.0% 8 80.0%
# 3.803547 1 10.0% 9 90.0%
# 3.985691 1 10.0% 10 100.0%
#
# Warning message:
# All observations are unique.
```
Learn more about this function with:
```r
?freq
```
### New classes
This package contains two new S3 classes: `mic` for MIC values (e.g. from Vitek or Phoenix) and `rsi` for antimicrobial drug interpretations (i.e. S, I and R). Both are actually ordered factors under the hood (an MIC of `2` being higher than `<=1` but lower than `>=32`, and for class `rsi` factors are ordered as `S < I < R`).
Both classes have extensions for existing generic functions like `print`, `summary` and `plot`.
```r
# Transform values to new classes
mic_data <- as.mic(c(">=32", "1.0", "8", "<=0.128", "8", "16", "16"))
rsi_data <- as.rsi(c(rep("S", 474), rep("I", 36), rep("R", 370)))
```
These functions also try to coerce valid values.
Quick overviews when just printing objects:
```r
mic_data
# Class 'mic': 7 isolates
#
# 0
#
# <=0.128 1 8 16 >=32
# 1 1 2 2 1
rsi_data
# Class 'rsi': 880 isolates
#
# : 0
# Sum of S: 474
# Sum of IR: 406
# - Sum of R: 370
# - Sum of I: 36
#
# %S %IR %I %R
# 53.9 46.1 4.1 42.0
```
A plot of `rsi_data`:
```r
plot(rsi_data)
```

A plot of `mic_data` (defaults to bar plot):
```r
plot(mic_data)
```

Other epidemiological functions:
```r
# Determine key antibiotic based on bacteria ID
key_antibiotics(...)
# Selection of first isolates of any patient
first_isolate(...)
# Calculate resistance levels of antibiotics, can be used with `summarise` (dplyr)
rsi(...)
# Predict resistance levels of antibiotics
rsi_predict(...)
# Get name of antibiotic by ATC code
abname(...)
abname("J01CR02", from = "atc", to = "umcg") # "AMCL"
```
### Databases included in package
Datasets to work with antibiotics and bacteria properties.
```r
# Dataset with 2000 random blood culture isolates from anonymised
# septic patients between 2001 and 2017 in 5 Dutch hospitals
septic_patients # A tibble: 4,000 x 47
# Dataset with ATC antibiotics codes, official names, trade names
# and DDD's (oral and parenteral)
antibiotics # A tibble: 420 x 18
# Dataset with bacteria codes and properties like gram stain and
# aerobic/anaerobic
microorganisms # A tibble: 2,453 x 12
```
## Authors
- [Berends MS](https://github.com/msberends)1,2, PhD Student
- [Luz CF](https://github.com/ceefluz)1, PhD Student
- [Hassing EEA](https://github.com/erwinhassing)2, Data Analyst (contributor)
1 Department of Medical Microbiology, University of Groningen, University Medical Center Groningen, Groningen, the Netherlands
2 Certe Medical Diagnostics & Advice, Groningen, the Netherlands
[](https://www.umcg.nl)[](https://www.certe.nl)[](http://www.eurhealth-1health.eu)[](http://www.eurhealth-1health.eu)
## Copyright
[](https://github.com/msberends/AMR/blob/master/LICENSE)
This R package is licensed under the [GNU General Public License (GPL) v2.0](https://github.com/msberends/AMR/blob/master/LICENSE). In a nutshell, this means that this package:
- May be used for commercial purposes
- May be used for private purposes
- May **not** be used for patent purposes
- May be modified, although:
- Modifications **must** be released under the same license when distributing the package
- Changes made to the code **must** be documented
- May be distributed, although:
- Source code **must** be made available when the package is distributed
- A copy of the license and copyright notice **must** be included with the package.
- Comes with a LIMITATION of liability
- Comes with NO warranty