AMR bar plots with ggplot
ggplot_rsi.RdUse these functions to create bar plots for antimicrobial resistance analysis. All functions rely on internal ggplot functions.
ggplot_rsi(data, position = NULL, x = "Antibiotic",
  fill = "Interpretation", facet = NULL, breaks = seq(0, 1, 0.1),
  limits = NULL, translate_ab = "official", fun = count_df,
  nrow = NULL, datalabels = TRUE, datalabels.size = 3,
  datalabels.colour = "grey15", ...)

geom_rsi(position = NULL, x = c("Antibiotic", "Interpretation"),
  fill = "Interpretation", translate_ab = "official", fun = count_df,
  ...)

facet_rsi(facet = c("Interpretation", "Antibiotic"), nrow = NULL)

scale_y_percent(breaks = seq(0, 1, 0.1), limits = NULL)

scale_rsi_colours()

theme_rsi()

labels_rsi_count(position = NULL, x = "Antibiotic",
  datalabels.size = 3, datalabels.colour = "grey15")
Arguments
| data | a |
|---|---|
| position | position adjustment of bars, either |
| x | variable to show on x axis, either |
| fill | variable to categorise using the plots legend, either |
| facet | variable to split plots by, either |
| breaks | numeric vector of positions |
| limits | numeric vector of length two providing limits of the scale, use |
| translate_ab | a column name of the |
| fun | function to transform |
| nrow | (when using |
| datalabels | show datalabels using |
| datalabels.size | size of the datalabels |
| datalabels.colour | colour of the datalabels |
| ... | other parameters passed on to |
Details
At default, the names of antibiotics will be shown on the plots using abname. This can be set with the option get_antibiotic_names (a logical value), so change it e.g. to FALSE with options(get_antibiotic_names = FALSE).
The functions
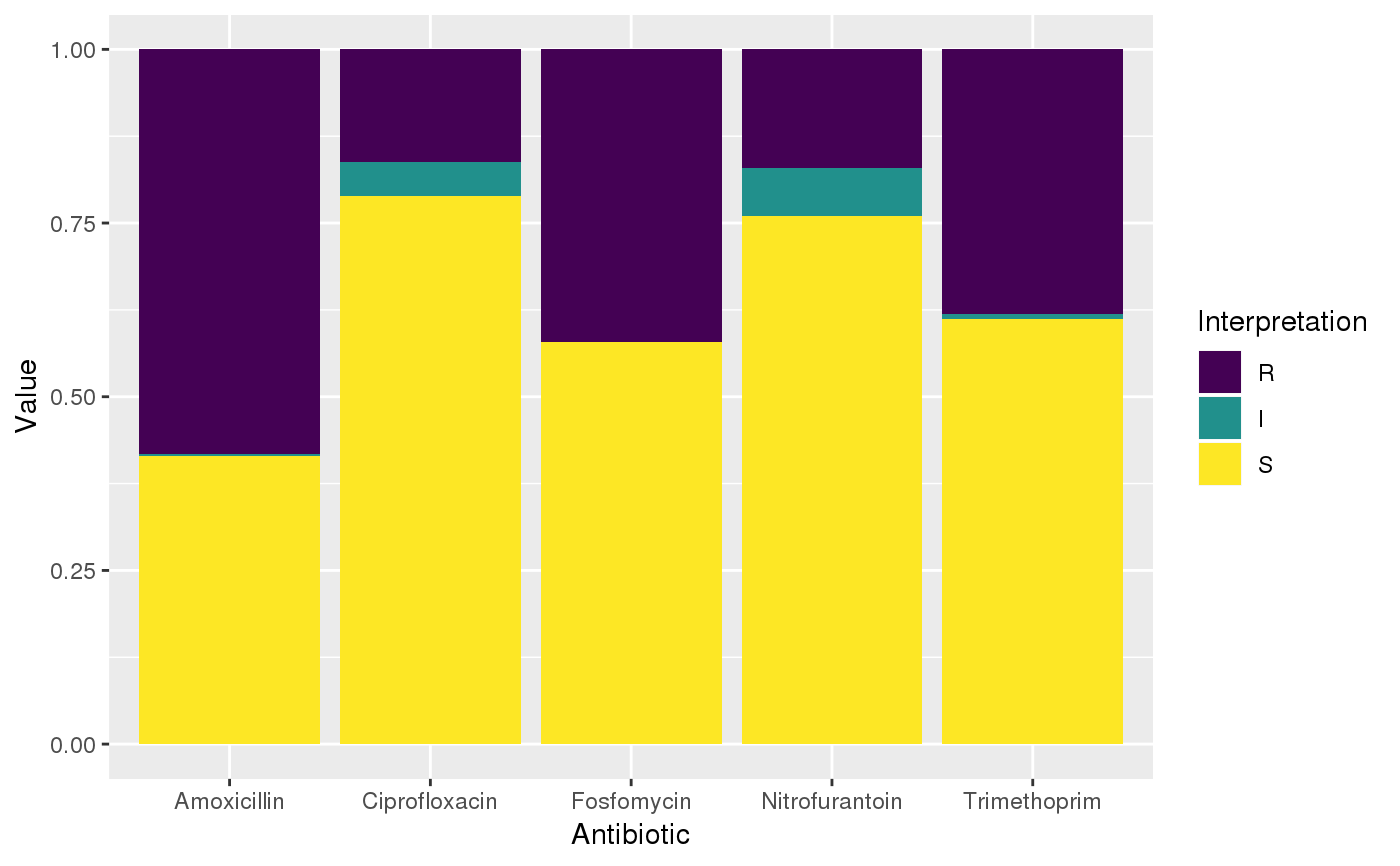
geom_rsi will take any variable from the data that has an rsi class (created with as.rsi) using fun (count_df at default, can also be portion_df) and will plot bars with the percentage R, I and S. The default behaviour is to have the bars stacked and to have the different antibiotics on the x axis.
facet_rsi creates 2d plots (at default based on S/I/R) using facet_wrap.
scale_y_percent transforms the y axis to a 0 to 100% range using scale_continuous.
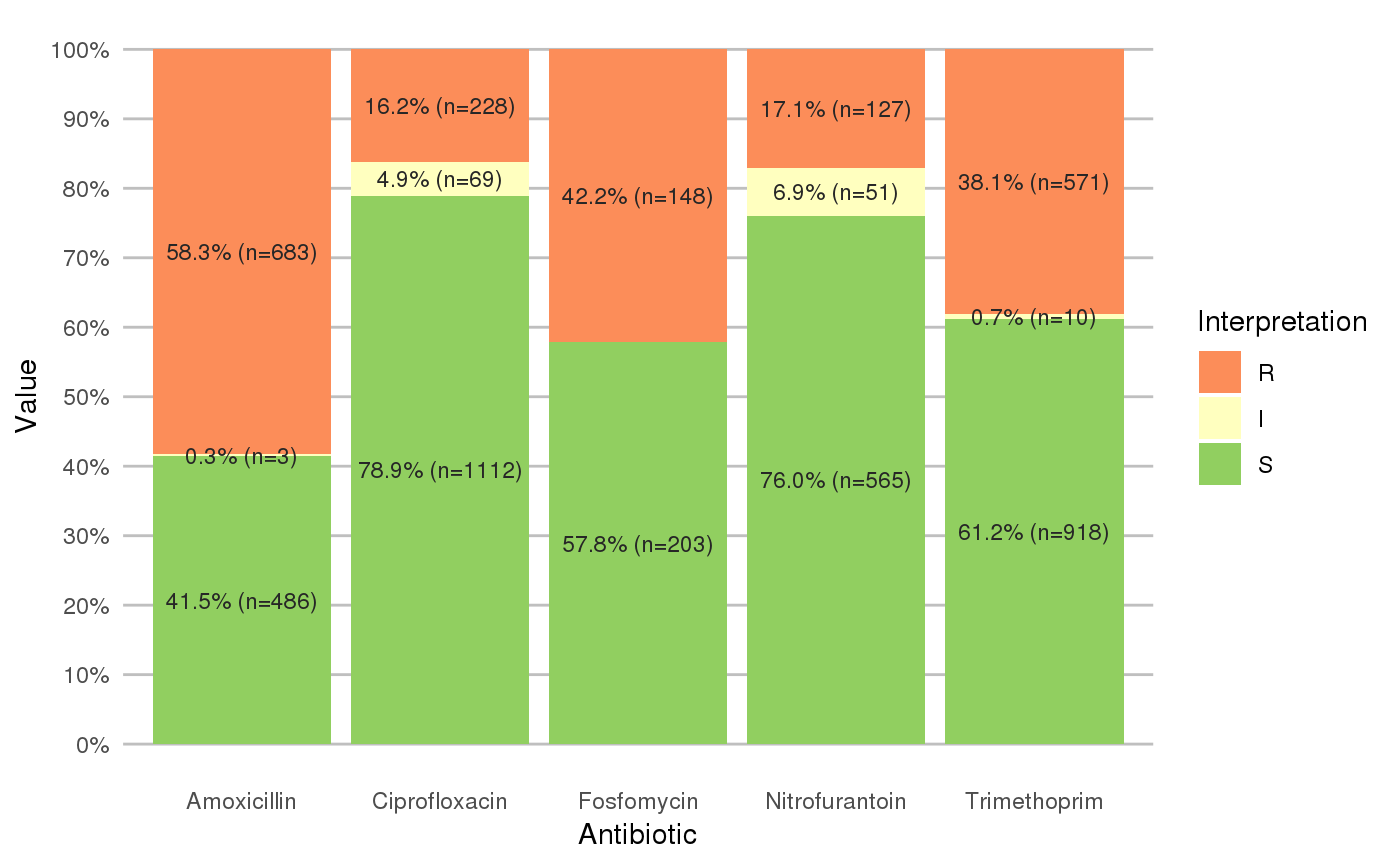
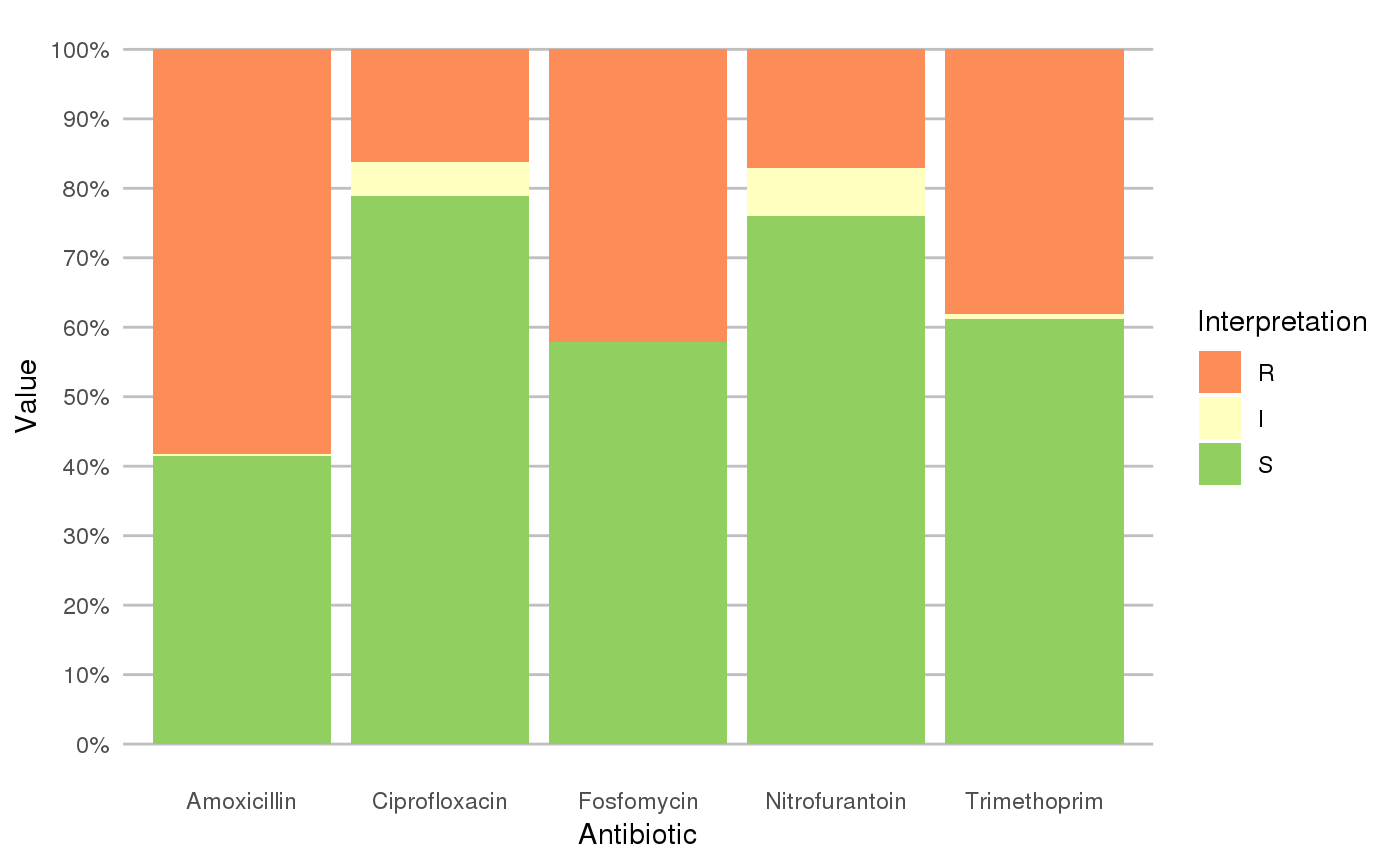
scale_rsi_colours sets colours to the bars: green for S, yellow for I and red for R, using scale_brewer.
theme_rsi is a ggplot theme with minimal distraction.
labels_rsi_count print datalabels on the bars with percentage and amount of isolates using geom_text
ggplot_rsi is a wrapper around all above functions that uses data as first input. This makes it possible to use this function after a pipe (%>%). See Examples.
Examples
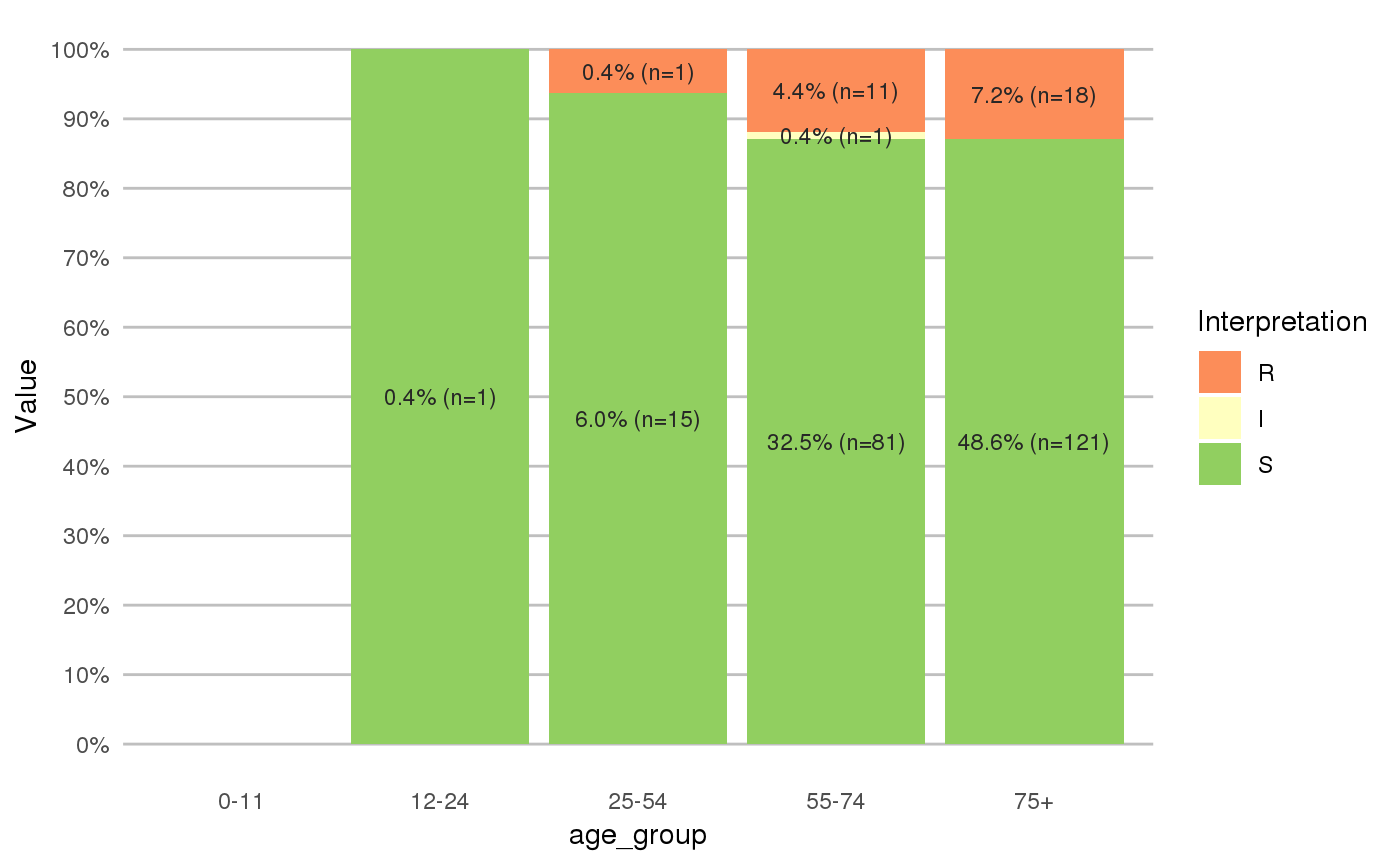
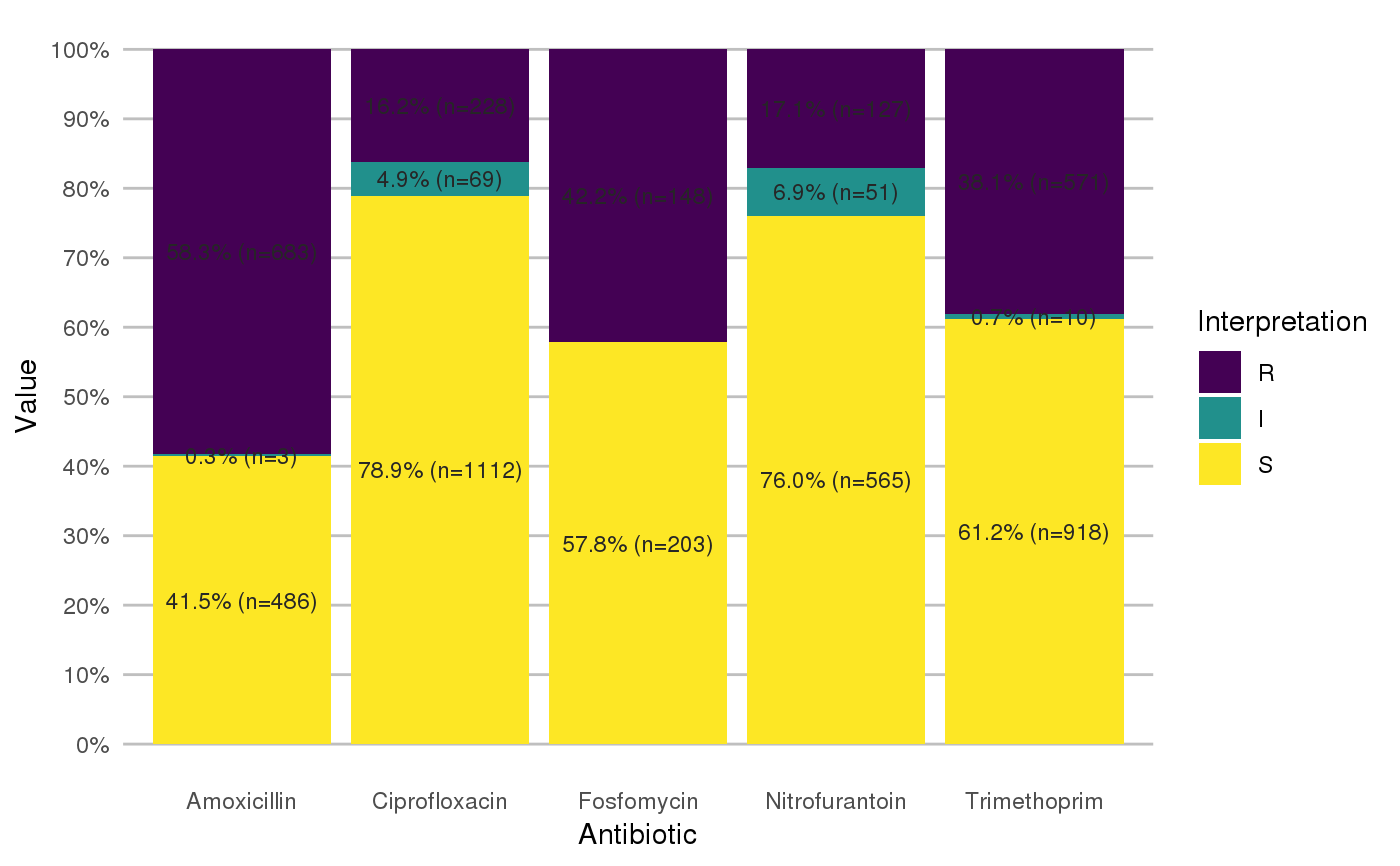
library(dplyr) library(ggplot2) # get antimicrobial results for drugs against a UTI: ggplot(septic_patients %>% select(amox, nitr, fosf, trim, cipr)) + geom_rsi()# prettify the plot using some additional functions: df <- septic_patients[, c("amox", "nitr", "fosf", "trim", "cipr")] ggplot(df) + geom_rsi() + scale_y_percent() + scale_rsi_colours() + labels_rsi_count() + theme_rsi()# or better yet, simplify this using the wrapper function - a single command: septic_patients %>% select(amox, nitr, fosf, trim, cipr) %>% ggplot_rsi()# get only portions and no counts: septic_patients %>% select(amox, nitr, fosf, trim, cipr) %>% ggplot_rsi(fun = portion_df)# add other ggplot2 parameters as you like: septic_patients %>% select(amox, nitr, fosf, trim, cipr) %>% ggplot_rsi(width = 0.5, colour = "black", size = 1, linetype = 2, alpha = 0.25)# resistance of ciprofloxacine per age group septic_patients %>% mutate(first_isolate = first_isolate(.)) %>% filter(first_isolate == TRUE, mo == as.mo("E. coli")) %>% # `age_group` is also a function of this package: group_by(age_group = age_groups(age)) %>% select(age_group, cipr) %>% ggplot_rsi(x = "age_group")#>#> NOTE: Using column `date` as input for `col_date`.#> NOTE: Using column `patient_id` as input for `col_patient_id`.#> 1,317 first isolates (65.9% of total)#> Warning: Removed 3 rows containing missing values (geom_bar).#> Warning: Removed 3 rows containing missing values (geom_text).# for colourblind mode, use divergent colours from the viridis package: septic_patients %>% select(amox, nitr, fosf, trim, cipr) %>% ggplot_rsi() + scale_fill_viridis_d()#> #># it also supports groups (don't forget to use the group var on `x` or `facet`): septic_patients %>% select(hospital_id, amox, nitr, fosf, trim, cipr) %>% group_by(hospital_id) %>% ggplot_rsi(x = hospital_id, facet = Antibiotic, nrow = 1) + labs(title = "AMR of Anti-UTI Drugs Per Hospital", x = "Hospital")#> Error in ggplot_rsi(., x = hospital_id, facet = Antibiotic, nrow = 1): object 'hospital_id' not found# genuine analysis: check 2 most prevalent microorganisms septic_patients %>% # create new bacterial ID's, with all CoNS under the same group (Becker et al.) mutate(mo = as.mo(mo, Becker = TRUE)) %>% # filter on top three bacterial ID's filter(mo %in% top_freq(freq(.$mo), 3)) %>% # determine first isolates mutate(first_isolate = first_isolate(., col_date = "date", col_patient_id = "patient_id", col_mo = "mo")) %>% # filter on first isolates filter(first_isolate == TRUE) %>% # get short MO names (like "E. coli") mutate(mo = mo_shortname(mo, Becker = TRUE)) %>% # select this short name and some antiseptic drugs select(mo, cfur, gent, cipr) %>% # group by MO group_by(mo) %>% # plot the thing, putting MOs on the facet ggplot_rsi(x = Antibiotic, facet = mo, translate_ab = FALSE, nrow = 1) + labs(title = "AMR of Top Three Microorganisms In Blood Culture Isolates", subtitle = "Only First Isolates, CoNS grouped according to Becker et al. (2014)", x = "Microorganisms")#>#> Error in ggplot_rsi(., x = Antibiotic, facet = mo, translate_ab = FALSE, nrow = 1): object 'Antibiotic' not found